4. Visualisation
When services start sequentially, responsibility for slow boot times is shared among many services. When services start in parallel, boot time is a function of those few services that lie on the critical path.
Example 1. Visualisation example
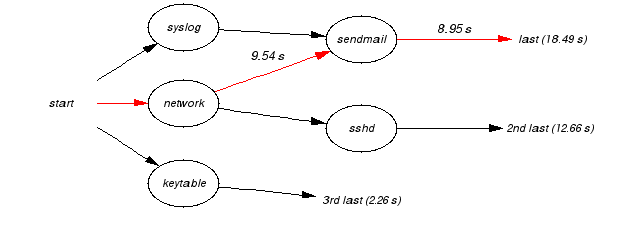
The image above shows services, relationships, timings, and the critical path. The image is a visualisation of the log file shown in Appendix B.
The three leftmost services have no dependencies. Once started, they run to completion in parallel.
sendmail blocks until both syslog and network have completed.
network ran for 9.54 seconds, sendmail ran 8.95 seconds, not counting the time it spent waiting for network and syslog to finish.
Red edges show the critical path of network followed by sendmail, running for a total of 18.49 seconds.
Can this system boot faster?
For this system to boot faster, either dependencies along the critical path must be untangled, or the individual services must be made to boot faster. Removing sendmail altogether would change the critical path to network followed by sshd, reducing boot time by about 5.8 seconds.
Visualisation credits
serel visualisation was inspired by the W3C RDF validation service. Analysis of the RDF is built on top of the Redland platform. The image is generated by AT+T's excellent GraphViz.
